
Daily Nugget:
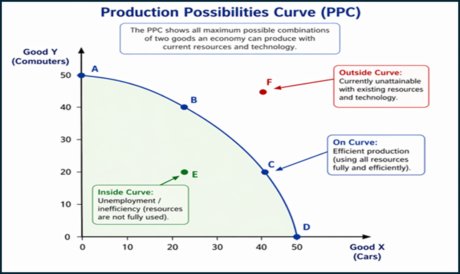
Observe the points on this PPC graph.
MCQs
1. A nation experiences a severe drought that destroys a large share of its wheat crop. This situation best illustrates
A. Comparative advantage
B. Scarcity
C. Equilibrium
D. Consumer sovereignty
Answer: B
Explanation: Scarcity exists because resources are limited relative to wants.
2. Which of the following best explains why scarcity exists in every economy?
A. Governments set prices inefficiently
B. Human wants exceed available resources
C. Producers seek profits
D. Consumers dislike trade-offs
Answer: B
Explanation: Unlimited wants and limited resources create scarcity.
3. A city uses land previously reserved for a public park to build a new hospital. The opportunity cost is
A. Cost of hospital materials
B. Value of park benefits forgone
C. Hospital revenue
D. Wages paid to workers
Answer: B
Explanation: Opportunity cost is the next best forgone alternative.
FRQ1. The table provided shows economic data for the country of Louland. The base year is year 1, and the GDP deflator in year 2 is 115.
(a) Calculate real GDP in Louland in year 2. Show your work.
(b) How would the change in real GDP from year 1 to year 2 affect the demand for money and the nominal interest rate in Louland?
(c) Did the standard of living of the average citizen in Louland increase, decrease, or remain the same from year 1 to year 2? Explain using numbers.
(d) What was the numerical value of the inflation rate from year 1 to year 2?
(e) If nominal wages increased by 10% from year 1 to year 2, what happened to the real wages of workers in Louland during this time? Explain.
(Source: AP Macroeconomics 2024 set 1)
Answers FRQ1:
(a) Calculate real GDP in Louland in year 2.
Real GDP =

Real GDP 2012 = 1,035,000/ (115/100) =1,035,000 / 1.15= $ 900,000
$900,000 (real GDP in year 2, in base-year prices).
(b) How would the change in real GDP from year 1 to year 2 affect the demand for money and the nominal interest rate?
· Real GDP rose from $800,000 → $900,000 (aggregate output ↑). Higher real GDP implies more transactions and a larger transaction demand for money.
· Holding the money supply fixed, an increase in money demand tends to raise the nominal interest rate (price of holding money).
(c) Did the standard of living of the average citizen change? Use numbers.
Compute real GDP per capita:
· Year 1: 800,000/1,000 = 800 (real GDP per person)
· Year 2: 900,000/1,200 = 750 (real GDP per person)
Change: 750 − 800 = −50, which is a −50 / 800×100 = −6.25% decline.
Answer: The average citizen’s standard of living decreased.
(d) What was the numerical value of the inflation rate from year 1 to year 2?
GDP deflator rose from 100 (base year) → 115.
Inflation rate = 115−100 / 100 × 100% = 15%
(e) If nominal wages increased by 10% from year 1 to year 2, what happened to real wages?
Approximate real wage change ≈ nominal wage change − inflation rate
Real wage change ≈ 10%−15% = −5%
So real wages fell by about 5%; workers’ purchasing power declined.
Daily Nugget
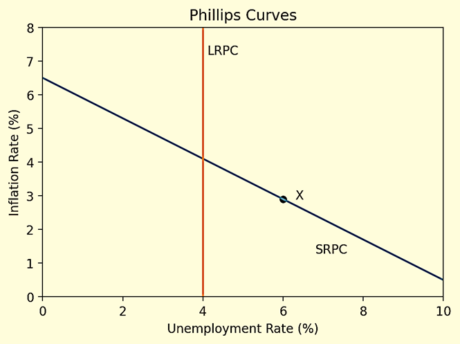
1. Refer to the Phillips-curve graph below. Point X shows an unemployment rate of 6 percent when the natural rate is 4 percent. Actual inflation at point X is most likely
A. greater than expected inflation
B. less than expected inflation
C. equal to expected inflation because unemployment is positive
D. equal to the natural rate of unemployment
Answer: B. Actual inflation at point X is most likely less than expected inflation.
Explanation: On a short-run Phillips curve, unemployment above the natural rate is associated with lower-than-expected inflation.
2. If real GDP rises by 10 percent while population rises by 15 percent, the average standard of living will most likely
A. rise because GDP is higher
B. fall because real GDP per capita declines
C. remain unchanged because both GDP and population rise
D. rise because inflation must be negative
Answer: B. The average standard of living will most likely fall because real GDP per capita declines.
Explanation: Population grew faster than output, so output per person decreased.
3. Which of the following would most likely reduce long-run aggregate supply?
A. A rise in the quantity and quality of education
B. A higher rate of private saving that finances investment
C. A decline in the labor force
D. An improvement in technology
Answer: C. A decline in the labor force would most likely reduce long-run aggregate supply.
Explanation: Fewer workers mean less potential output.
FRQ. Initially, the real interest rates in the United States and Japan are equal to 7 percent. The real interest rate in the United States increases to 8 percent while the real interest rate in Japan decreases to 6 percent.
(a) How and why will capital flows be affected by this change in real interest rates?
(b) Using a correctly labeled graph for the yen market, show and explain how the value of the yen will change relative to the value of the dollar.
(c) Explain how the change in the value of the yen will affect each of the following in the United States.
(i) Imports from Japan
(ii) Exports to Japan
Source: AP Macroeconomics 2002
Answer FRQ:
(a) Higher real returns (8%) attract foreign investors seeking higher yields; capital moves into the country with the higher real interest rate.
(b)

Because investors move funds to the U.S., demand for yen falls (relative to before. The yen depreciates (its value falls) relative to the dollar.
(c) Effects on U.S.–Japan trade:
(i) Imports from Japan — increase.
The yen depreciates relative to the dollar, meaning the dollar appreciates relative to the yen. Japanese goods become cheaper in dollar terms, so U.S. consumers buy more imports from Japan.
(ii) Exports to Japan — decrease.
A stronger dollar and weaker yen make U.S. goods more expensive for Japanese consumers, so U.S. exports to Japan decrease.
Daily Nugget
Ø Spending Multiplier = 
Ø Tax Multiplier = 
Ø MPC + MPS = 1
Ø Change in GDP = Multiplier × Initial Change
Practice:
The government wants to increase aggregate demand during a recession. Suppose the marginal propensity to consume (MPC) is 0.8.
1. Calculate the spending multiplier.
2. Calculate the tax multiplier.
3. If the government increases spending by $50 billion, how much will real GDP increase?
4. If the government decreases taxes by $20 billion, how much will real GDP change?
5. What is the marginal propensity to save (MPS)?


Change in GDP = Multiplier × Initial Change

Answers:
1. Spending multiplier = 1/(1 − 0.8) = 5
2. Tax multiplier = −0.8/(1 − 0.8) = −4
3. Change in GDP = 5 × $50 billion = +$250 billion
4. Change in GDP = (−4) × (−$20 billion tax cut) = +$80 billion
5. MPS = 1 − 0.8 = 0.2
FISCAL POLICY
Used by government to influence AD to close wealth gaps.
• Expansionary: increase government spending, decrease taxes
• Contractionary: decrease government spending, increase taxes
CROWDING OUT
· Expansionary Policy → Aggregate Demand (AD) shifts right
· Contractionary Policy → Aggregate Demand (AD) shifts left
· Government Borrowing ↑ → rate of interest ↑ → Investment ↓ (Crowding Out)